Document Type : Original Article
Authors
Department of BioTechnology Vignan's Foundation for Science, Technology & Research Guntur, A.P, India
Abstract
Introduction: Sars-cov-2 heredities have spread around the world and have been declared a worldwide pandemic. Thus, additional research is required. In this research, we used bioinformatics approaches such as structure prediction and phylogenetic analysis to investigate the anticipated tyrosine phosphatase receptors of omicron.
Methods: The phylogenetic analysis was conducted Mega 5.2 (molecular evolutionary genetics analysis version 5.2). Homology modelling was performed using the Swiss-model, Phyre 2, and I-Tasser, and the best model was proposed using procheck, prosa, errat, and verify-3D.
Results: The results of this study indicate active interactions between escherichia coli and homo sapiens in phylogeny and modelling, with 88.6 percent of the builds happening in the most favourable region, 11.2% in the allowed region, 0.6 percent in the freely permitted region, and 0.2 percent in the forbidden zone. In this study, phylogenetic analysis and homology model was developed for tyrosine phosphatase receptor by using Swiss-model, Phyre 2, and I-Tasser. The developed models were validated by using Errat, verify-3D, Prove, Prosa, and Ddfire.
Conclusion: The analysis can be used in future for drug design and can also be passed from one generation to the next through inheritance which helps us to learn about evolutionary relationships.
Graphical Abstract
)
Keywords
- Introduction
The sars-cov2 developed a new variant called omicron (b.1.1.529). It was first reported by WHO. This variant contains a typically large number of mutations and has been characterized by changes of 30 amino acids in the structure of the parent strain. Hence, it is declared as a variant of concern [1, 2]. It is more contagious and has less impact on our respiratory system than other variants, but due to its exceedingly spread around the world, vaccination is deemed necessary for this variant [3]. Compared with other variations such as sars-cov-2 501.v2 (b.1.351 lineage), and voc 202012/01 (b.1.1.7 lineage), omicron has more mutations [4]. All three variants contain an n501y mutation on the spike protein receptor-binding domain (rbd). Which is required for viral entrance into the host cells via binding to the human receptor ace2 (hace2) [5]. Compared with other mutations such as e484k, the b.1.1.7 is found to be more infectious, with a faster spreading rate and a greater binding affinity to the ace2 receptor [6]. Nonetheless, more research is required on host cell signalling mechanisms in the newly emerged variants, to increase understanding of the process of how species evolve as a result of genetic changes [7], and knowing a protein's structure could allow designing the site-directed mutations with the goal of changing the function of resultant proteins [8]. Here, it is aimed to investigate the potential of the tyrosine phosphatase receptors in model prediction and phylogenetic analysis of omicron, as a sars-cov2 variant.
Phylogenetics habitually constitutes tree diagrams, which represent the interrelationship among the organisms and branching molecular approaches, it is a highly important bioinformatics approach and its proficiency in data handling makes the evolutionary tree delineation analysis of phylogeny an easy way to represent the data [8]. The phylogenetic tree is used to identify the omicron in numerous evolutionary species by using novel approaches. The study of evolutionary correlation described in phylogenetic analysis is determined by the correlation of different organisms [9]. Homology modelling, this method uses tyrosine phosphatase receptor and predicts the structure of a subject protein from its sequence through protein modelling. Then, molecular function of the protein provides a 3D protein structure. The 3D structure of the omicron variant was experimentally not available and there is no structural information available regarding its protein sequence. Therefore, the structure was predicted through the homology modelling by using a computational approach this can be useful in further studies like modelling ligand docking and understanding the degree of receptor-ligand interaction.
- Materials and Methods
2.1. Phylogeny analysis in omicron b.1.1.529 of tyrosine phosphatase receptor sequence analysis
The trimmed protein sequences of different species reported in omicron isolates were first locally aligned by using the basic local alignment search tool (blast) algorithm provided by national centre for biotechnology information (ncbi).
2.2. Sequence retrieval
To compare the similarity or diversity, the protein sequences need to be downloaded [10]. The partial sequences of 19 selected omicron-reported species along with homo sapiens; namely, rhinolophus sinicus, escherichia coli, cocos nucifera, zingiber officinale, etc., were retrieved from ncbi (http://www.ncbi.nlm.nih.gov/). The species names along with accession numbers are represented in Table 1.
Table 1. Similar proteins obtained from non-redundant database with the omicron B.1.1.529 tyrosine phosphatase receptor
|
Accession |
|||||||||
|
1 |
294 |
294 |
100% |
3.00E-100 |
100.00% |
149 |
|||
|
2 |
597 |
597 |
100% |
0 |
100.00% |
288 |
|||
|
3 |
633 |
633 |
100% |
0 |
100.00% |
310 |
|||
|
4 |
494 |
494 |
100% |
6.00E-176 |
94.84% |
252 |
|||
|
5 |
294 |
294 |
100% |
1.00E-100 |
100.00% |
142 |
|||
|
6 |
505 |
505 |
100% |
1.00E-180 |
100.00% |
246 |
|||
|
7 |
555 |
555 |
100% |
0 |
100.00% |
274 |
|||
|
8 |
513 |
513 |
100% |
0 |
100.00% |
248 |
|||
|
9 |
526 |
526 |
100% |
0 |
100.00% |
256 |
|||
|
10 |
629 |
629 |
100% |
0 |
100.00% |
307 |
|||
|
11 |
517 |
517 |
100% |
0 |
100.00% |
252 |
|||
|
12 |
543 |
543 |
100% |
0 |
100.00% |
264 |
|||
|
13 |
515 |
515 |
100% |
0 |
100.00% |
250 |
|||
|
14 |
451 |
451 |
100% |
5.00E-160 |
100.00% |
218 |
|||
|
15 |
485 |
485 |
100% |
6.00E-173 |
100.00% |
237 |
|||
|
16 |
502 |
502 |
94% |
5.00E-179 |
98.02% |
252 |
|||
|
17 |
517 |
517 |
100% |
0 |
100.00% |
252 |
|||
|
18 |
3009 |
3009 |
100% |
0 |
100.00% |
1439 |
2.3. Framework selection and multiple sequence alignment for maximum likelihood analysis
Clustalw 1.6 included in the mega5.05 program was used to conduct multiple sequence alignment. To arrange protein sequences to find areas of similarity that may be the result of evolutionary links between the sequences. Mega 5.05 was used to develop an algorithm to calculate the best model phylogeny, by using the distance matrix to find the protein sequence parallelism and the estimation of nucleotides was performed by the different algorithms namely neighbor-joining algorithm, maximum composite likelihood algorithm, and upgma. Then, it will evaluate the best model by using tajima’s neutrality test.
2.4. Molecular evolutionary relationships analysis
The evolutionary history was estimated by using the maximum likelihood method (mL) which is the most suitable model, other than the neighbour-joining method (nj) and upgma (non-weighted pair group method with arithmetic mean). The evolutionary history of the species studied was represented by bootstrap consensus trees estimated from 1000 repetitions. The nearest neighbour-interchange heuristic technique was used to generate the mL trees. All places with gaps and incomplete data were removed from the dataset (complete deletion option). Mega5.05 [10] was used to perform phylogenetic studies.
2.5. Estimation of various evolutionary factors among different species of omicron
Omicron sequences from different species were classified individually to allow for an easier estimation of diversity among species. Kimura-2-parameter model [11] and 1000 bootstrap variance estimation technique is used to evaluate the mean diversity within subpopulations, diversity within a species population, inter-population diversity, and coefficient of divergence across species groups. For omicron, the codon locations considered were 1st+2nd+3rd+noncoding. All places with gaps and incomplete data were removed from the dataset (select deletion option).
2.6. Estimate of relative evolutionary rate and tajima’s neutrality test
The mean (relative) evolutionary rate for each nucleotide site was estimated by using the kimura-2-parameter model [11] with the invariant site (+i), which has the third-lowest Bayesian information criterion (bic) value, just higher than the Kimura 2-parameter model [11], and the jukes-cantor [12] model with the uniform rate depicted in Figure 1. Tajima's neutrality test [13] was used in the final data set to test the neutral theory of molecular evolution and discover population structure.

Figure 1. Jukes-Cantor model with uniform rate various species
2.7. Homology modeling tyrosine phosphatase receptor of Omicron:
Homology modeling is flourishing for the build of the 3d structure of target sequences. The omicron variant is calibrated with the template and peripheral structure is estimated between the two. A more existant model of the predominant sequence of target is acquired from the degree of sequence specifications and the resemblance between protein and target that is related to the precision of the homology model [14] [15]. For the success of homology modeling, there is a proclivity of an acceptable template and sequence alignment is obligatory [16]. Finding the template structure for pdb we need to perform the blastp. Layout recognition was executed by using psi-blast to glance at non-redundant pdb data base [17]. Best 5 hits recovered by the blast p program are appeared in (Table 2).
Table 2. Best hit obtained by PSI-BLAST with the omicron B.1.1.529 tyrosine phosphatase receptor accessions ID: AAC51938.1
|
Accessions |
Max Score |
Accession Length |
Taxic Id |
Total Scores |
P- Value |
E- Value |
Max Score |
Pre. Ident |
Qurey Covers |
|
AAC51938.1 |
100 |
1439 |
906 |
1439 |
1 |
0 |
3009 |
100 |
100% |
|
NP_573438.3 |
99.514 |
1440 |
906 |
1439 |
1 |
0 |
2992 |
99.65 |
100% |
|
PNI20496.1 |
99.375 |
1440 |
9558 |
1439 |
1 |
0 |
2985 |
99.51 |
100% |
|
PNJ90271.1 |
99.306 |
1440 |
9601 |
1439 |
1 |
0 |
2985 |
99.44 |
100% |
|
XP_016813230.1 |
99.237 |
1442 |
9598 |
1439 |
1 |
0 |
2983 |
99.38 |
100% |
|
XP_034815596.1 |
99.168 |
1442 |
9597 |
1439 |
1 |
0 |
2981 |
99.31 |
100% |
|
XP_018869442.1 |
99.168 |
1442 |
9595 |
1439 |
1 |
0 |
2981 |
99.31 |
100% |
|
XP_032615468.1 |
99.098 |
1442 |
81572 |
1439 |
1 |
0 |
2979 |
99.31 |
100% |
2.8. Evaluation of homology model
Swiss-model, I-Tasser, and Phyre 2 were employed to generate mutant structures for omicron. Compared with other two software, the Swiss algorithm produced model is the best and evaluated by using procheck, prosa,errat and verify 3D. It identifies the best 85% and 90% grouping identity. The approval of structure demonstrates acquired from Swiss-model, I-Tasser, and Phyre 2 was performed by reviewing the spine conformation of the modelled structure. Procheck will give you a visual examination of the quality of a putative gene structure for a protein and the compatibility analyse of a nuclear model of the protein with its amino acid arrangement. This process was done by analysing the phi (φ) and psi (ψ) torsion points by using procheck, as determined by ramachandran plot. Based on an analysis of 118 structures of resolution of at least 2.0 angstroms and r-factor no greater than 20%, a good quality model would be expected to have over 90% of residues in the most favoured regions. Residues in most favoured regions [a, b, l] [156] 87.9%, residues in additional allowed regions [a, b, l, and p] [20] 11.4%, residues in generously allowed regions [~a, ~b, ~l, and ~p] [0] 0.0%, residues in disallowed regions [0] 0.0%. Errat is a protein structure confirmation algorithm that is particularly well-suited for assessing the advancement of crystallographic show building and refinement. This program works by analysing the measurements of non-bonded interactions between different molecules in the given model. It is greatly valuable in making choices about unwavering quality.
- Results
All of the omicron sp strains utilised in the study had 96 to 99% sequence similarity to homo sapiens or escherichia coli sp. These aligned sequences were used to generate a consensus mL tree. Mega5 software is used to generate a phylogram from the multiple alignment file to quantify the confidence of tree topologies by bootstrap analysis of 1000 repetitions. The initial tree(s) for the heuristic search were generated automatically by applying the neighbor joining and upgma algorithms on a matrix of pairwise distances evaluated by using the maximum composite likelihood (mcl) method, and then picking the topology with the highest log likelihood value. The tree is shown to scale, and branch lengths are quantified in terms of the number of substitutions per site. The study included 60 nucleotide sequences. All spots with gaps and incomplete data were removed. All of these investigations by the maximum composite likelihood (mcl) yield the greatest results when compared with the neighbour joining and upgma methods, as demonstrated in Figure 2.

Figure 2. Phylogeny analysis of different sps compared with Homo sapiens with target protein omicron B.1.1.529 tyrosine phosphatase receptor with true distance.
The mean (relative) evolutionary rates (estimated by using the k2 parameter model) were scaled so that the average evolutionary rate across all locations was one. This suggests that sites with a rate of 1 evolve slower than the average, whereas those with a rate greater than 1 evolve faster than the average (Figure 3). The model [20] (+i) was used to calculate these relative rates. To simulate evolutionary rate variations between sites, a discrete gamma (+g) distribution was utilised (1 category). Some sites were permitted to remain invariant (+i). Figure 3 clearly demonstrated this feature. The maximum sites demonstrated a mean (relative) evolutionary rate of 1, implying that the maximum sites demonstrated an evolutionary rate that was slower than the average rate.
Tajima's neutrality test revealed that the population's nucleotide diversity was 0.230, and the tajima test statistic (d) was 0.351. Comparative sequence analysis was used in this work to evaluate molecular evolutionary divergence and categories the sequences into several species of omicron reported, such as homo sapiens, escherichia coli, mus muscles, etc.
Figure 3. The maximum sites demonstrated a mean (relative) evolutionary rate of 1.
3.1. Homology modeling by using swiss-model
The total generation of the template for the omicron protein in Swiss-model was presented corresponding with the target succession, and the shaped structure designed as 10 based on 6 with the resolution of 2 å appears as the only information covering 100% residues with a q-mean Z- score of 0.7. The protein sequence of omicron in the Swiss model server produces an efficient template (Table 3). The target template matches the distribution of nearly 15 sequences individually and the deviation from the problem alignment is 0%, which gives us an efficient model generated by the Swiss model software (Figure 4). Viewing 3D structures allows you to sketch Swiss modelled protein chemical structures and reactions, as well as biological objects and pathways (Figure 5).
Table 3. Comparative values of Procheck, Errat, Verify_3D, and Prove Z-score in different stages of refinement used in the Swiss-Model software
|
Validation |
After Modeling |
Refine Loop |
Minimize |
Predict Side Chain |
|
Ramachandran Plot Allowed |
87.9% |
88.1% |
82.3% |
87.2% |
|
Ramachandran Plot Disallowed |
0.2% |
0.1% |
0.0% |
0.0% |
|
Errat |
84.3% |
84.8% |
85.5% |
85.4% |
|
Verify 3D |
65.33% |
71.1% |
64.1% |
67.1% |
|
Prove Z-score |
0.72 |
0.54 |
0.53 |
0.5 |
 Figure 4. Homology modelling on tyrosine phosphatase receptor of omicron protein by using Swiss-Model, Phyre2, and I-Tasser
Figure 5. Chem draw structure of omicron B.1.1.529 tyrosine phosphatase receptor
3.2. Homology modelling by using I-TASSER
In the view of this approach, the target concatenation is primarily yarned by using a typically pdb structure library to look for the feasible folds by profile-profile alignment proctored by Markov cluster algorithm indicating the psi-blast profiles. Out of ten calculations of pdb Needleman-Wunsch and Smith Waterman Marshaling algorithm has the finest Z-score, which is used for the modeling of omicron structure. I-tasser server prognosticates 5 replicates form with the finest C-score as −1.5, which is chosen with the approximate precision of 0.5 (tm score) and 4.149% (rmsd). The C-score is the confidence score for assessing the attainment of the predicted models based on the importance of threading layout alignment and the intersection parameters of the structure assembly simulations (Table 4).
Table 4. Comparative values of Procheck, ProQ, Errat, Verify_3D, Prove, Pros A, and Z-scores between the template and modelled protein of all the three models
|
Validation |
|
Swiss-Model |
I-Tasser |
Phyre2 |
|
Procheck |
Ramachandran Plot allowed |
87.9% |
65.1% |
88.7% |
|
|
Additionally allowed |
12.4% |
3.5 % |
7.5% |
|
|
Generously allowed |
0.0% |
9.5% |
2.3% |
|
|
Disallowed region |
0.0% |
4.2% |
0.6% |
|
Errat |
|
87.9% |
62.4% |
60.5% |
|
ProsA Z-score |
|
-6.7% |
-5.5% |
-4.0% |
|
Verify_3D |
|
80.1% |
62.3% |
68.4% |
3.3. Homology modeling by using PHYRE2
The foremost target of phyre 2 is useful for the prediction which involves in structure analysis and functions of protein. The pdb file format was submitted along with protein sequence. The demonstrated residues are 98% and the first model of protein tyrosine phosphate of omicron with a high score layout. The confidence in the model is 100%
3.4. Model validation
These findings revealed that the majority of the amino acids are in phi-psi dissemination, which is consistent with a program. Procheck was used to calculate ramachandran plots. The ramachandran plot of the three models was approved after counting the geometric qualities of the backbone conformations (Figure 6a). The storyline may be found in the alpha helix and beta sheets. The right-handed -helix and the demonstration are both trustworthy and of high quality. Despite the fact that the other two models did not perform as well as the swiss-model (Figure 6b & 6c), the Swiss model’s display received a z score of 6.72 (Figure 10), indicating that the demonstration produced by the Swiss model was excellent, even though the other two models met the standards with an lg score of 2. Errat (Figure 7), pros A and verify 3D(Figures 8 and 9).

Figure 6. Ramachandran plot for the modelled on tyrosine phosphatase receptor of omicron protein after refinement. The red, yellow, and white regions represent the favoured, allowed, and disallowed regions, respectively
|
(a). Swiss-Model |
|
(b). I-Tasser |
|
(c). Phyre2 |


Figure 7. Errat plot on tyrosine phosphatase receptor of omicron protein modelled by (a) Swiss-Model, (b) I-Tasser, (C) Phyre2, and overall quality factor or Errat score
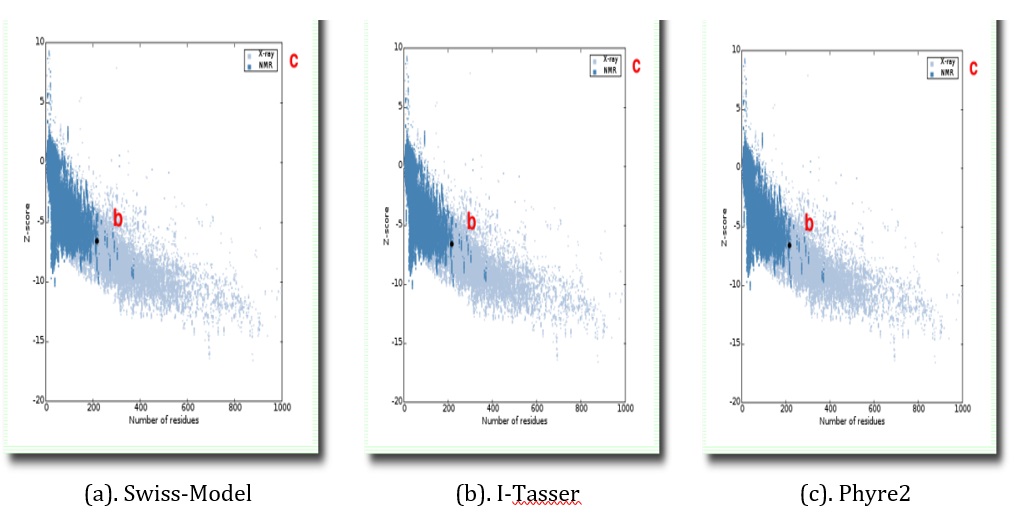
Figure 8. Pros A-web Z-scores tyrosine phosphatase receptor of omicron model (black spot) concerning all protein chains in PDB determined by X-ray crystallography (light blue) or NMR spectroscopy (dark blue) to them
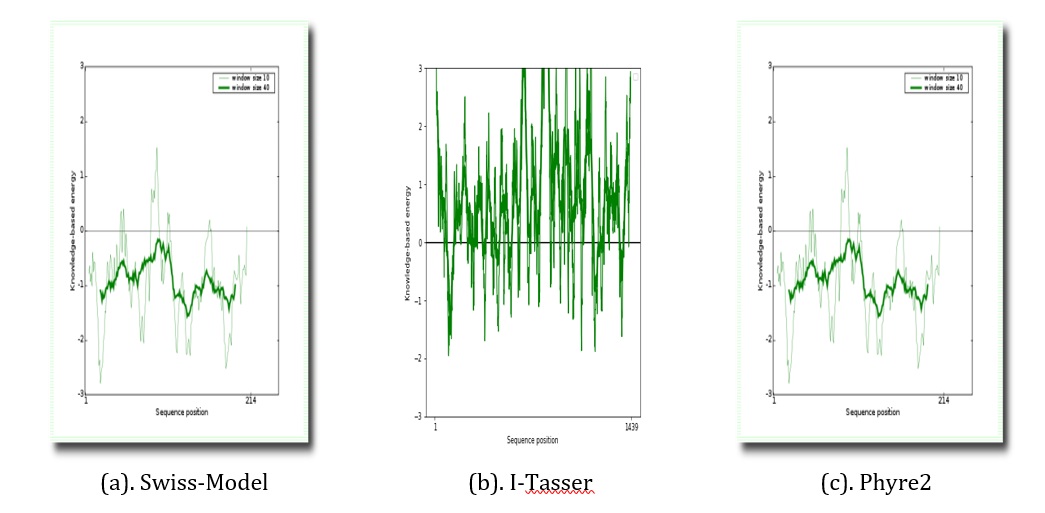
Figure 9. Verify 3D residue energy plots on tyrosine phosphatase receptor of omicron from Swiss- Model, Phyre2, and I-Tasser

(P). Swiss-Model

(Q). I-Tasser

(R). Phyre2
Figure 10. Prove average Z-Score and RMS Z-Score value plots for tyrosine phosphatase receptor of omicron from Swiss-Model, Phyre2, and I-Tasser
- Conclusion
The evolutionary actively engaged in portraying about the phylogeny analysis is assertion and relation of various organisms. In that, we constructed 3 models among that we selected the best model which was the maximum likelihood. This method assessment systematically contributed consistent distribution over the tectonic region and the errors are very low that it is correlated with the distribution, which is suitable for the preliminary analysis that can be used for further studies and the best model can proceed for further studies like meta genome, comparative analysis, and taxonomic analysis. In the present study, it accurately demonstrates the homology based 3D structure of omicron developed by three different software programs which are Swiss model, I-Tasser and Phyre 2. The best and accurate structure was dispensed by the software, such as the models predicted by Swiss model, I-Tasser, and Phyro are considered and scrutinized by Procheck, Errat, verify 3D, and pros A servers. Where the model predicted by Swiss model is identified as the best and accurate under the scrutiny of the above mentioned platforms. Behalf to that furthermore, the online authorize server (Proa Web) showed that Z-score and energy of the protein crumbling of the structure was in the outstanding assertion with the approachable protein structure in pdb which preferred in attribution of the above mentioned structure. The study affirmed the homology model shown by Swiss model.
Acknowledgement
I sincerely thank Agri it solutions (Start-up Company) for its constant support.
Author’s Role
Venu paritala conceived of the presented idea and developed the theory and performed the computations. Harsha Thummala verified the analytical methods, investigated, and supervised the findings of this work. We also thank T.N.S. Mohith for his help during the data collection. All authors discussed the results and contributed to the final manuscript.
Conflicts of Interest
The authors declare no conflicts of interest.
Financial support: None
Ethics statement: None
- Baek M, Di Maio F, Anishchenko I, Dauparas J, Ovchinnikov S, Lee G R, Wang J, Cong Q, Kinch L N, Schaeffer R D, Millán C. (2021). Accurate prediction of protein structures and interactions using a three-track neural network. Science., 373(6557): 871-876. [Crossref], [Google Scholar], [Publisher]
- Benassi E, Fan H, Sun Q, Dukenbayev K, Wang Q, Shaimoldina A, Assanbiyeva A, Nurtay L, Nurkesh A, Kutzhanova A, et al. (2021). Herbal Food Processing Generation of Particle Assembly Mimicking Enzymatic Activity: The Case of Rhizoma Polygonati and Other Natural Ingredients of Traditional Chinese Medicine., Nanoscale Adv., 3: 2222-2235. [Crossref], [Google Scholar], [Publisher]
- Kazybay B, Ahmad A, Mu C, Mengdesh D, Xie Y. (2022). Omicron N501Y mutation among SARS-CoV-2 lineages: In-silico analysis of potent binding to tyrosine kinase and hypothetical repurposed medicine, Travel Medicine and Infectious Disease., 47: 846. [Crossref], [Google Scholar], [Publisher]
- Fouad Dabboussi, Monzer Hamze, Malika Elomari, Sophie Verhille, Nader Baida, Daniel Izard, Henri Leclerc. (1999). Taxonomic study of bacteria isolated from Lebanese spring waters: proposal for Pseudomonas cedrella sp. nov. and P. orientalis sp. nov., Res Microbiol., 150: 303-316. [Crossref], [Google Scholar], [Publisher]
- Elomari M, Coroler L, Hoste B, Gillis M, Izard D, Leclerc H. (1996). DNA Relatedness among Pseudomonas Strains Isolated from Natural Mineral Waters and Proposal of Pseudomonas veronii sp. nov. Int J Syst Bacteriol., 46: 1138. [Crossref], [Google Scholar], [Publisher]
- Mark W. Silby, Craig Winstanley, Scott A.C. Godfrey, Stuart B. Levy, Robert W. Jackson, Pseudomonas genomes: diverse and adaptable, FEMS Microbiology Reviews, Volume 35, Issue 4, July 2011, Pages 652–680,[Crossref], [Google Scholar], [Publisher]
- Behrendt U, Ulrich A, Schumann P, Meyer J M, Spröer C, Affiliations V. (2007). Pseudomonas lurida sp. nov., a fluorescent species associated with the phyllosphere of grasses Free. Int J Syst Evol Microbiol., 57: 979. [Crossref], [Google Scholar], [Publisher]
- Hughes A L, Nei M. (1988). Pattern of nucleotide substitution at major histocompatibility complex class I loci reveals overdominant selection. Nature. 335: 167. [Crossref], [Google Scholar], [Publisher]
- Hollister J R, Vagnozzi A, Knowles N J, Rieder E. (2008). Molecular and phylogenetic analyses of bovine rhinovirus type 2 shows it is closely related to foot-and-mouth disease virus. Virology, 373: 411–425. [Crossref], [Google Scholar], [Publisher]
- Kimura M. (1980). A simple method for estimating evolutionary rates of base substitutions through comparative studies of nucleotide sequences. J Mol Evol., 16: 11-120. [Crossref], [Google Scholar], [Publisher]
- Tajima F. (1989). Statistical method for testing the neutral mutation hypothesis by DNA polymorphism. Genetics. 123: 585. [Crossref], [Google Scholar], [Publisher]
- Betts A O, Edington N, Jennings A R, Reed S E. (1971) Studies on a rhinovirus (EC11) derived from a calf. II. Disease in calves. Comp. Pathol., 81: 41–48. [Crossref], [Google Scholar], [Publisher]
- Ng KK, Cherney M M, Vazquez A L, Machin A, Alonso J M, Parra F, James M N. (2002). Crystal structures of active and inactive conformations of a caliciviral RNA-dependent RNA polymerase. Biol. Chem., 277: 1381–1387. [Crossref], [Google Scholar], [Publisher]
- Adhikari A, Nandi S, Bhattacharya I, Roy MD, Mandal T, Dutta S. (2015). Phylogenetic analysis based evolutionary study of 16S rRNA in known Pseudomonas sp. Bioinformation., 11(10): 474-80. [Crossref], [Google Scholar], [Publisher]
- Rai DK, Rieder E. (2012). Homology modeling and analysis of structure predictions of the bovine rhinitis B virus RNA dependent RNA polymerase (RdRp). Int J Mol Sci., 13(7): 8998-9013. [Crossref], [Google Scholar], [Publisher]
- Paritala V. (2022). Comparative Modeling For Saccharomyces Cerevisiae Rad56 Using Swiss-Model, I-Tasser, And Phyre2., International Journal of Pharmacy and Pharmaceutical Sciences, 14(4): 28-33. [Crossref], [Google Scholar], [Publisher]
- National Center for Biotechnology Information (2022). PubChem Compound Summary for CID 2244, Aspirin. Retrieved July 11, 2022 from https://pubchem.ncbi.nlm.nih.gov/compound/2244. [Crossref], [Google Scholar], [Publisher]
)